Meeting Minute #4
Date: 23/05/2024
Time: 10 – 10.30 pm
Location: SMU
Attendees: Arya Siahaan, Seng Jing Yi, Thet Myat Noe
Agenda:
Discussion on dilemma faced during data cleaning for MC2.
Discussion on insights derived from knowledge graphs and other visualisations.
Discussion on details for project proposal.
Meeting Notes:
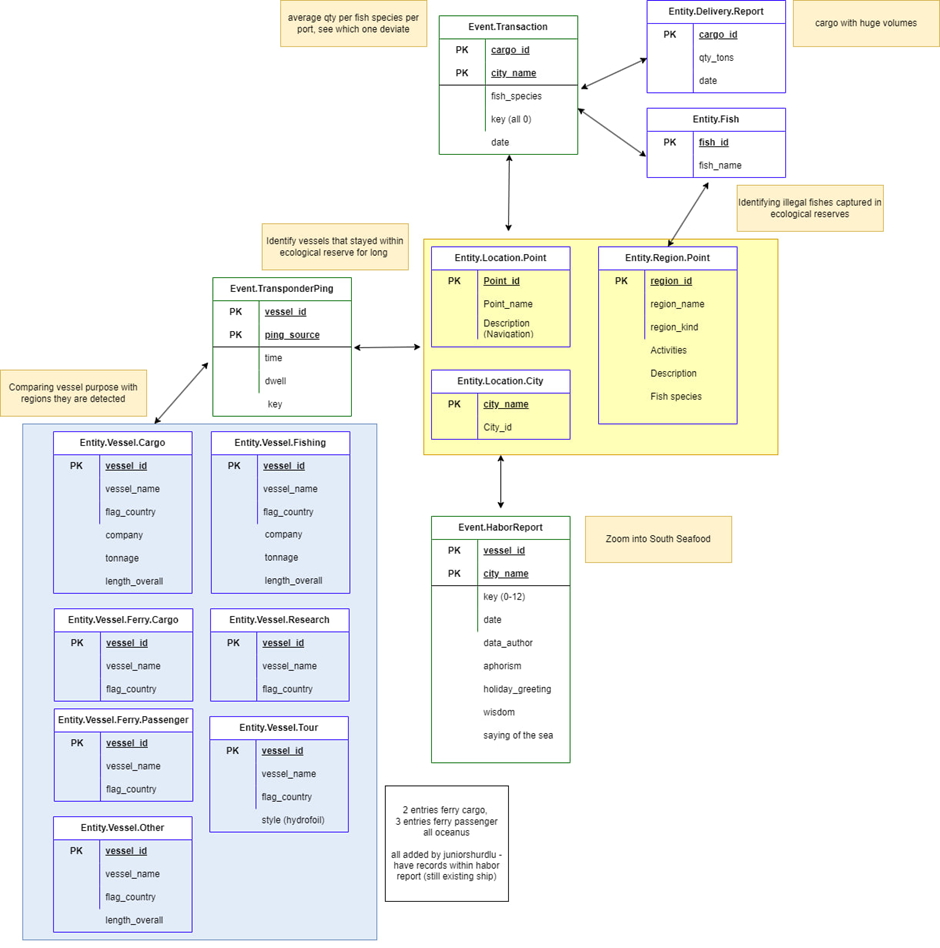
Team discussed the considerations during data cleaning for MC2, ranging from relabelling of columns, removing of duplicates and possible connector for MC2 sub-question 1 on linking cargo_id to vessel_id.
- Discussion point #1: Aligning of headers and dropping of duplicate columns.
Identified primary keys to link the “Event” edges with the “Entity” nodes.
- Cargo_id between Event. Transaction, Entity.Delivery.Report
- Vessel_id between Event.TransponderPing and Event.HaborReport with Entity.Vessel
Columns to drop due to duplicated information.
- City_name with City_id
- Region_name with Region_id
- Point_name with Point_id
- Data_author with city_name
- Discussion point #2: Handling nested list within data tables.
For Entity.Region.Point, nested list include:
Activities in region (e.g., Commercial fishing, Deep Sea Fishing)
Fish species in Region (e.g.,Wrasse/Labridae n.refert, Beauvoir/Habeas pisces)
- Discussion point #3: Handling unique columns for certain entity tables.
Event.Transponder,Ping: To determine meaning of “Key”
- Discussion point #4: Possible calculated fields
For “Event.Transponder.Ping”: Aggregate the dwell time per vessel per ping source to identify time that the vessel spent most.
For “Event.Transaction”:
- Identify cargo with illegal fish species
- Match possible regions where fish can be fished vs city_name where the ship has been to see if there’s any overlap for illegal fishing.
Team also discussed the possible connection between the different data table. This can be used as a basis to draw the preliminary knowledge graph used for visualisation of relationship between the various nodes.
Team discussed possible visualisation to explore:
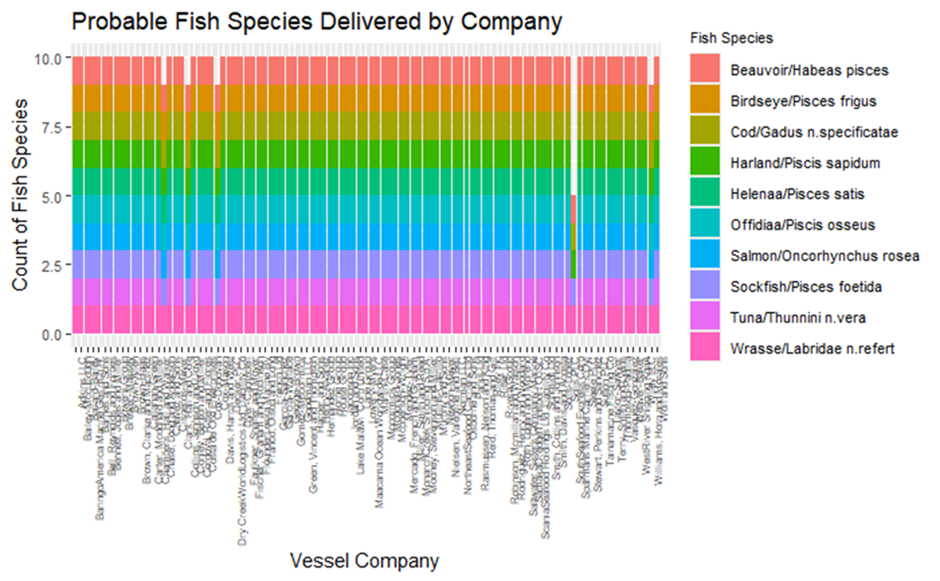
- Visualisation #1: Distribution of fish species captured by the respective vessel companies.
Subsequent steps:
Identifying companies that deviate from the norm
Identifying companies that have uncommon or suspicious fish species.
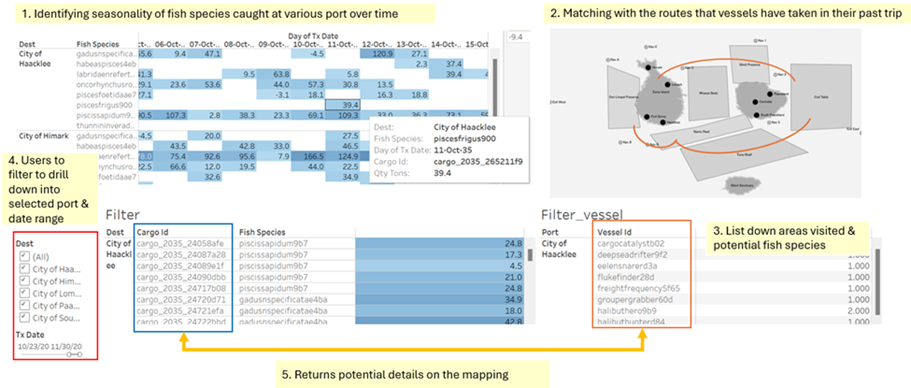
- Visualisation #2: Interactive data-table to return the list of cargos and the vessels at the ports by specifying the date and selected port.
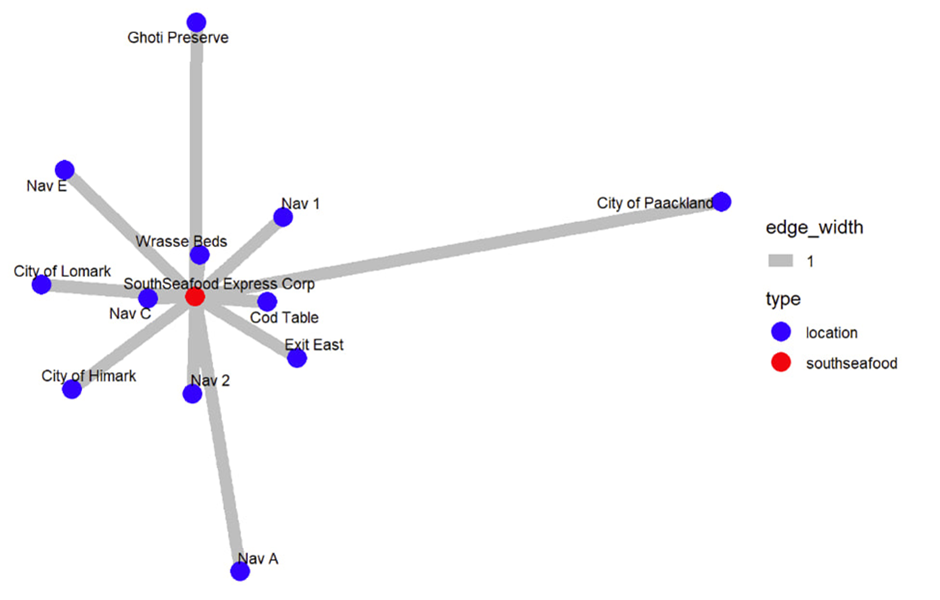
- Visualisation #3: Vessel movement, zooming into South Seafood Express Corp
Subsequent steps:
Identifying the common regions that vessel move.
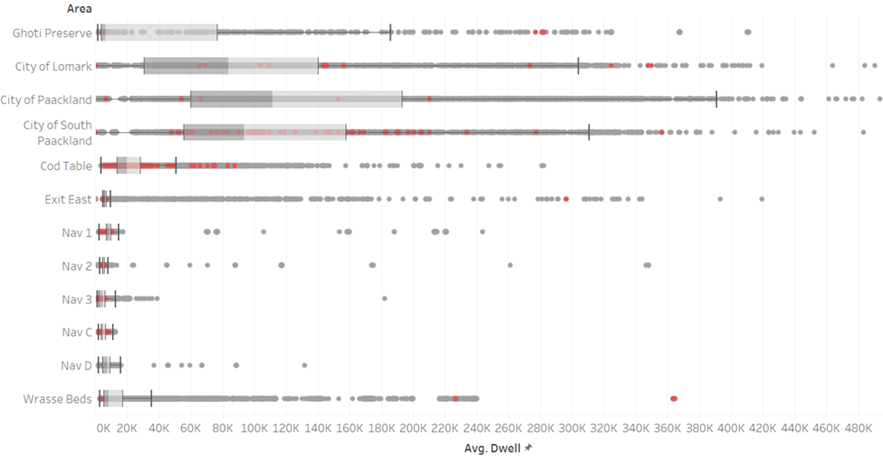
Identifying common areas where fishing occurs & dwell time.
- Visualisation #4: Diving into the time spent by vessels at the respective areas to identify vessels that have over-stayed in areas where fishing is not allowed (e.g., Ghoti Reserve)
Next steps are agreed as follows:
Work on the details for the project proposal (Deadline of 25 May 2024).
Push project proposal details onto git.
Action Items:
| Action items | Owner(s) | Deadline |
|---|---|---|
| Data cleaning and processing for MC2 | Arya, Jing Yi, Myat | 28 May 2024 |
| Exploring knowledge graph and potential visualizations for MC2 sub questions | Arya, Jing Yi, Myat | 28 May 2024 |
| Draft details for project proposal | Arya, Jing Yi, Myat | 28 May 2024 |
| Commit, push and pull files from common git | Arya, Jing Yi, Myat | 28 May 2024 |
Action items review from previous meetings.
Go through process and challenges from data cleaning for MC2.
Go through insights derived from knowledge graphs and other visualisations.
Discuss project proposal details.