Proposal for Mini Challenge 2
1. Motivation of the project
To prevent illegal fishing from happening again, FishEye analyst aims to perform geographic and temporal analysis of CatchNet data.
2. Issues that the project will address
| Sub-question | Issues to Address |
|---|---|
| Visualisation system to associate vessels with probable cargo. | Identify which vessel deliver which products and when. Uncover any seasonal trends and anomalities in port exit records. |
| Visualisation to illustrate inappropriate behaviour of SouthSeafood Express Corp Vessels. | Compare SouthSeafood Express Corp vessel’s movement and catch contents relative to other fishing vessels. Identify when and where South Seafood Express Corp performed their illegal fishing. Justify the different types of suspicious behaviours observed. |
| Visual Analytics workflow to discover other vessels with potential illegal fishing activities. | Identify vessels and companies engaging in similar behaviour to South Seafood Express Corp and visualise similarities. |
| Visualisation on how fishing activity changed after South Seafood Express Corp was caught | Contrast the fishing behaviour and identify which behaviours are most suspicious and justify why they may be illegal. |
4. The approach the team plans to take to solve the problem & early prototype
4.1 Sub-question 1:
In order to associate vessels with their probable cargo, Transaction data and delivery doc data can be match first to determine which cargo contain which fish species.
This step is followed by connecting transponder ping data of vessels to ports with deliver date of cargo. This will give probable link between and vessels and cargo.
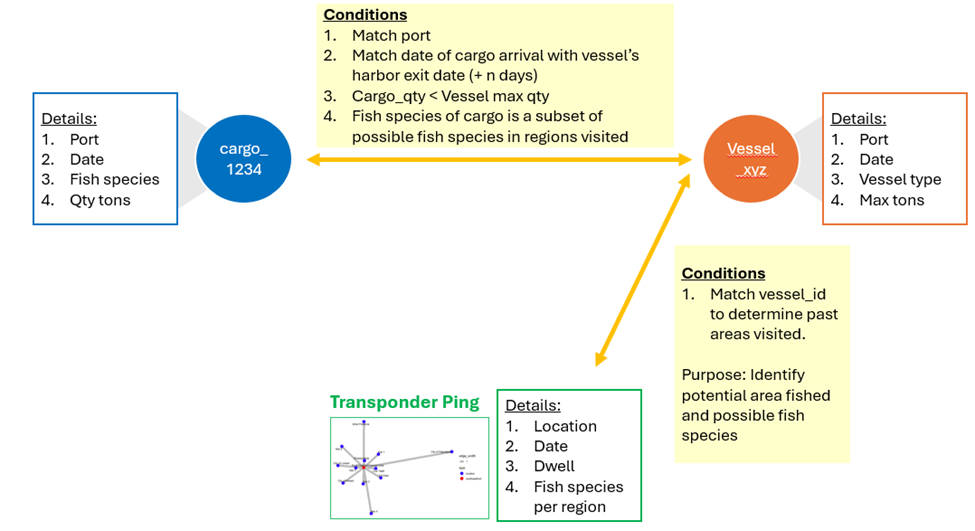
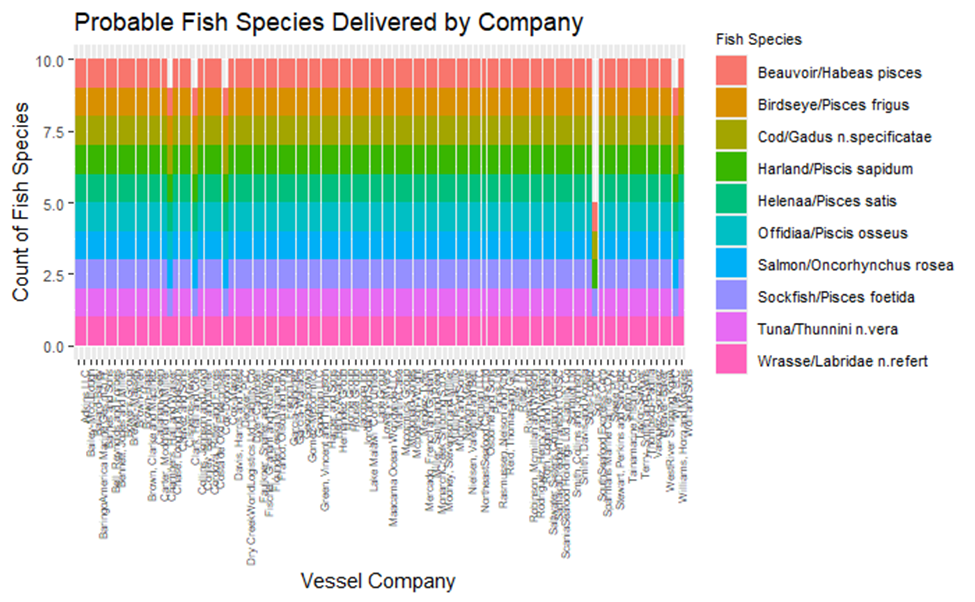
Using this data, visualisations can be performed to show which vessels/company deliver which cargo/ fish species. These visualisations can be further break down by season to check any seasonal trends in cargo delivery.
4.1.1 Early Prototype for Sub-question 1:
Interactive data table with the purpose of returning the list of `cargo_id` and `vessel_id` based on filtering of `Port name` and `Date` (+/- 5 days) and underlying conditions as defined above.
4.2 Sub-question 2:
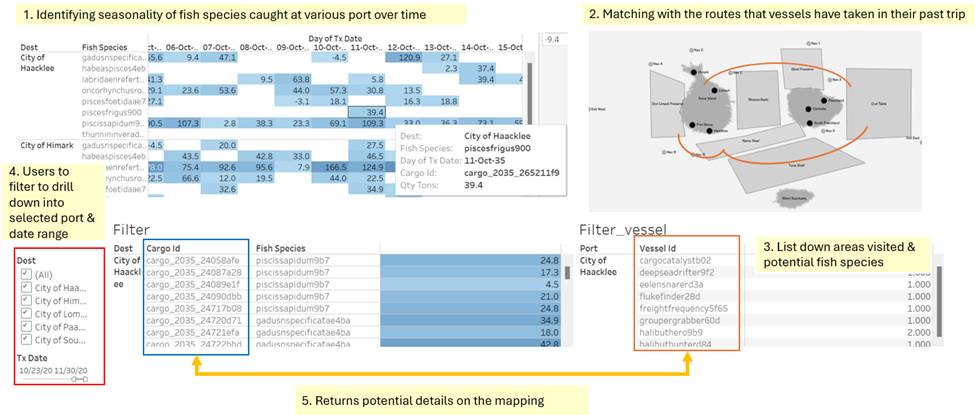
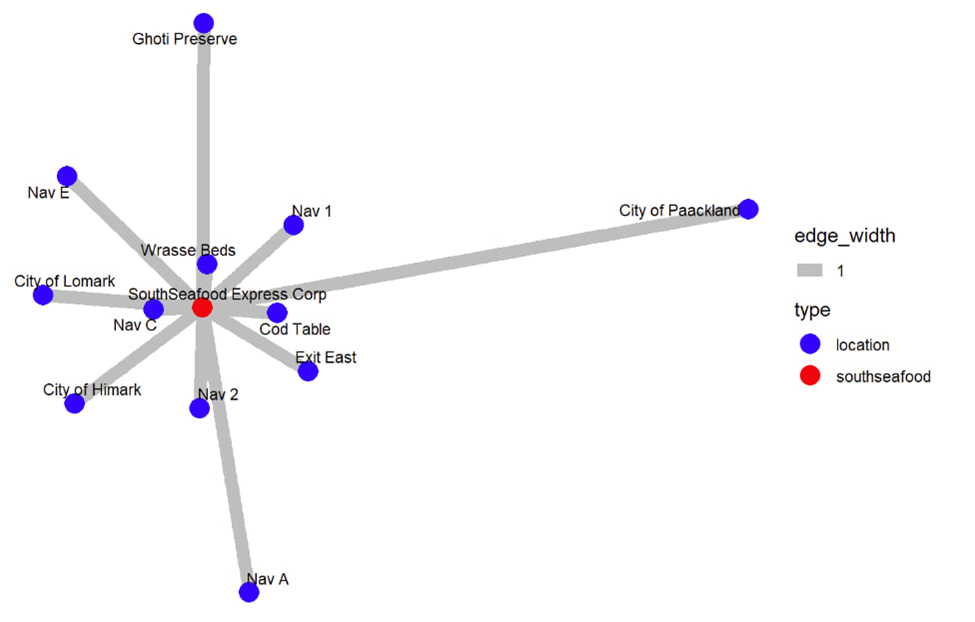
To answer where SouthSeafood Express Corp vessels perform their illegal fishing, graph visualization based on Vessels’ transponder ping data can be used to map locations that SouthSeafood Express Corp vessels been to. This visualization will uncover suspicious activities such as vessel visiting locations not designated for fishing. By checking the timestamp of these suspicious activities, it is possible to determine when illegal fishing was being performed. The vessels movement of SouthSeafood Express Corp can be visualized in comparison with other companies in Oceanus to confirm SouthSeafood illegal fishing behaviour.
Referring to sub-question 1, vessels can be connected to their respective probable cargo. Visualization of SouthSeafood Express Corp vessels and their probable cargo can be compared to that of other companies to determine how does the fishing activity varies.
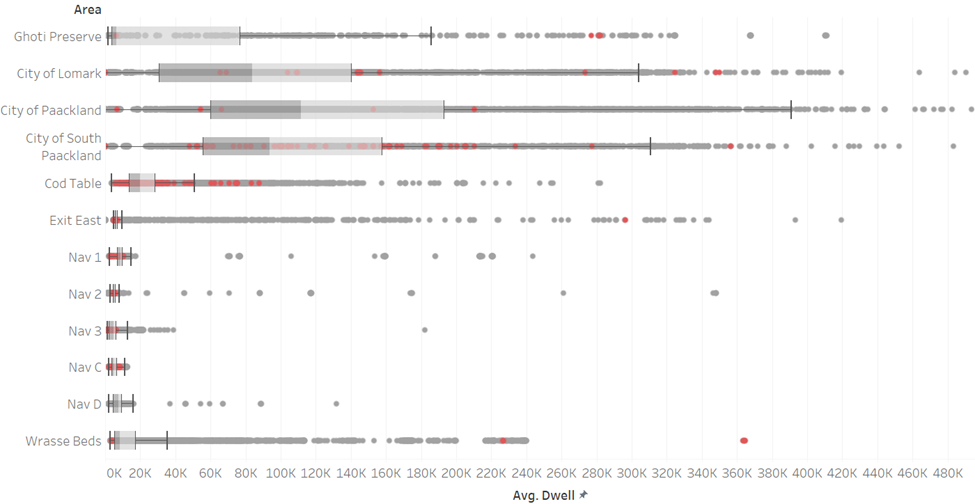
On measure used to describe fishing activity is the relative time spent at respective regions, in comparison to other vessels of similar nature. Filtering the vessel by type (fishing), tonnage and overall length and most frequently visited ports, we can observe the typical behaviour of vessels similar to South Seafood Express. From there, we can compare their relative catch to see if South Seafood Express is able to have higher cargo tonnage at their subsequent port.
4.2.1 Early Prototype for Sub-question 2:
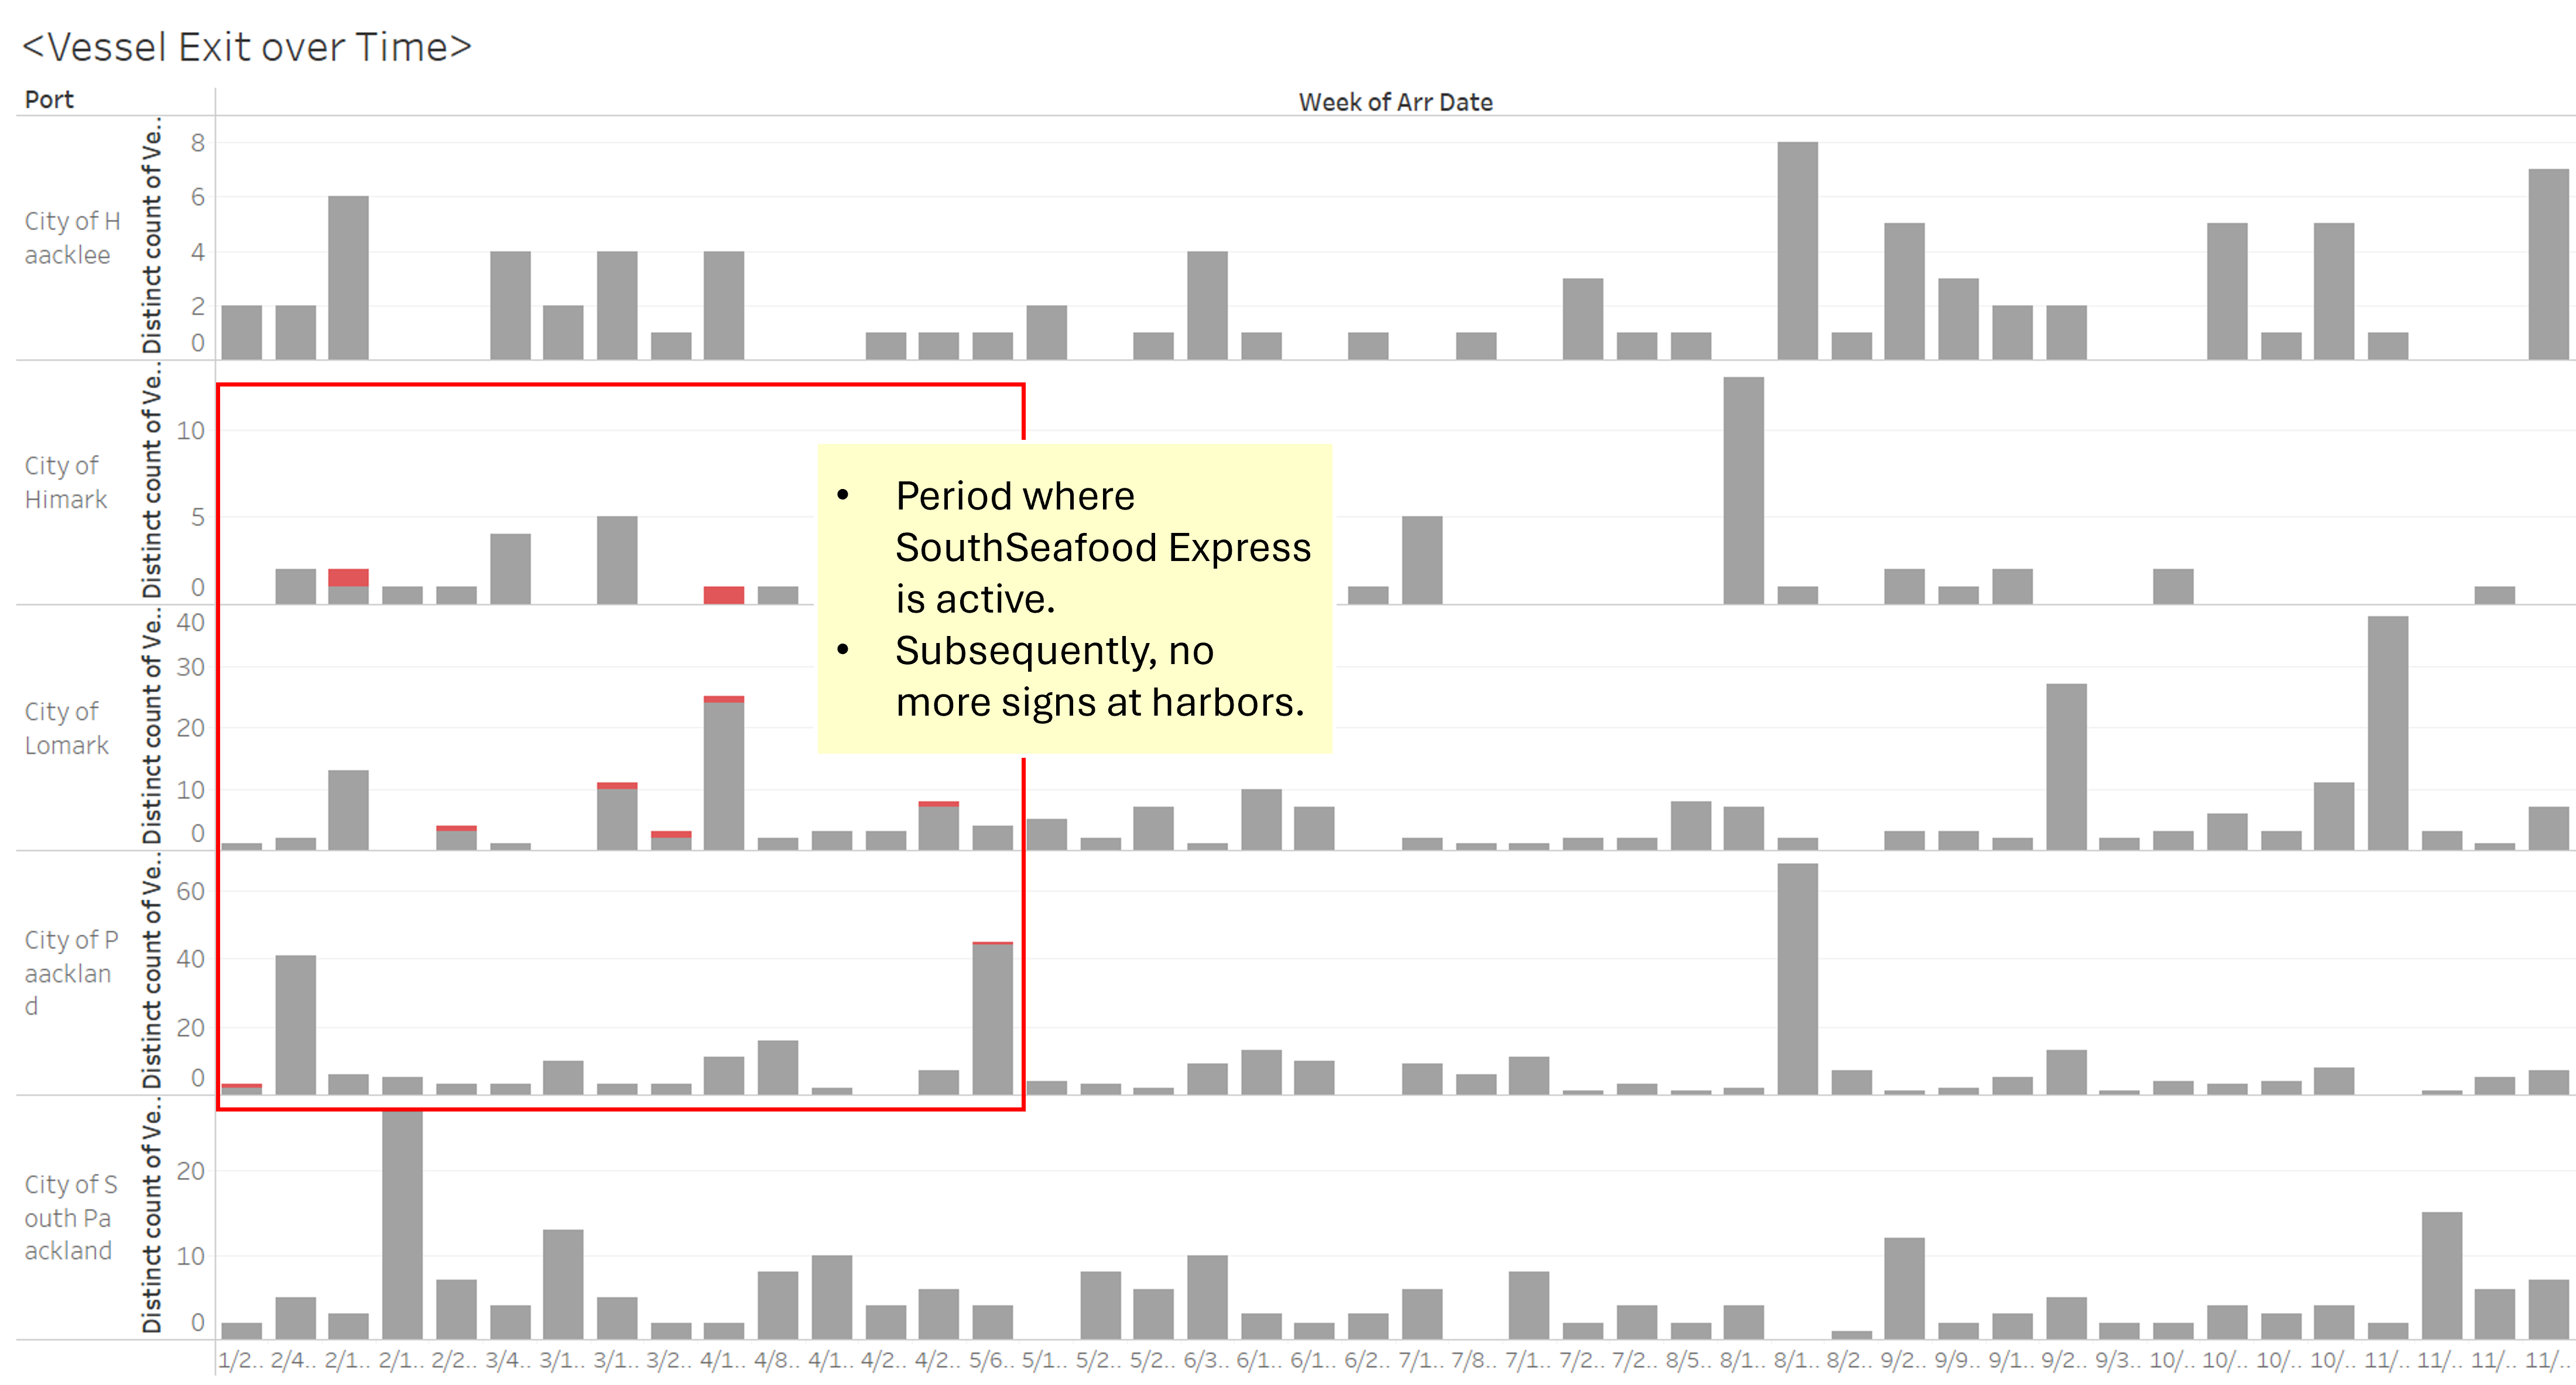
SouthSeafood Express Corp Vessels Movement
Exploring the relative dwell time that SouthSeafood Express Corp Vessels spend at their respective regions in comparison to other vessels. (Red: SouthSeafood Express Corp Vessels; Grey: Other vessels)
(Note: Diagrams below are illustrative, further fine-tuning is required for representative visualization)
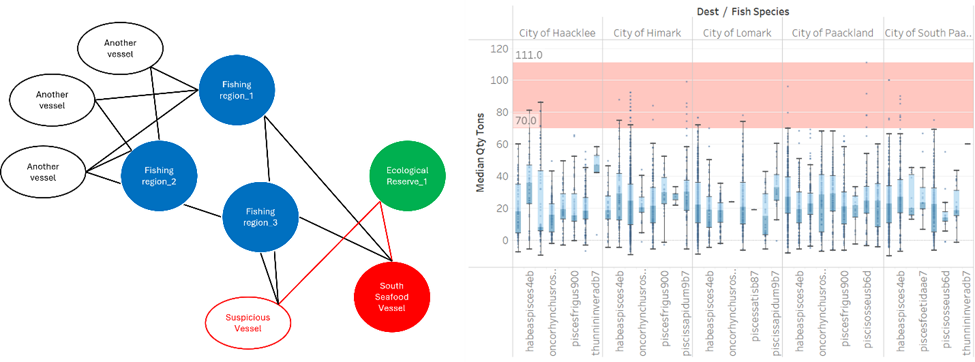
After mapping the cargo to their probable vessels, we identify the expected catch from vessels that have taken similar routes as South Seafood Express Corp vessels. Comparing the breakdown of their cargo, we should observe that South Seafood Express Corp has more catch from their illegal fishing activities.
(Note: Diagrams below are illustrative, further fine-tuning is required for representative visualization)
4.3 Sub-question 3:
Identifying vessels with similar travel pattern as South Seafood Express Corp
Identifying vessels with high dwell time in non-fishing areas.
Identifying vessels that have associated cargo with illegal fish species.
4.4 Sub-question 4:
Perform temporal analysis to see when South Seafood Vessels stop operation.
Compare the travel patterns of other vessels before and after the timeframe that South Seafood Vessels ceased operation.
Compare the cargo quantity of fish caught at the various ports before and after South Seafood Vessels ceased operation.
4.4.1 Early Prototype for Sub-question 4:
Temporal Analysis on SouthSeafood Express Corp’s vessel’s operations.